Do you believe in the world's most extensive conspiracy theory - "Human-made global warming" (Also known as "Human-Made Climate Change)? See this:
 |
| Anthropogenic cause "Global climate crisis" - "the world's most extensive conspiracy theory" |
Do you believe in the world's most extensive conspiracy theory?
Known as "Human-made global warming" or
"Human-Made Climate Change"
By Jim T. Slaaen
Only a handful of countries have to cuttheir "Greenhouse gas"-emissions, according to COP21 (2015 Paris Agreement), not ALL.WHY, if there really is a climate crisis?
If emissions of these so-called "greenhouse gases" really have a demonstrable impact on the climate; Why do the climate hysterics and Green Fascists believe that the anthropogenic contribution, which corresponds to only 2.8‰ (per thousand) of what nature itself emits, is MORE harmful to the climate than the nature itself? Can someone explain it, preferably with a link to empirical real scientific evidence based on real observations and records that follow the standard of the scientific method, and is clear evidence that we the people who live in Japan, Canada, The United States, and in West Europa (EU, including the EEA (Iceland, Liechtenstein, and Norway), Switzerland and Great Britain), is causing the alleged "man-made climate change" since we are the only ones who are forced to reduce our CO₂ emissions according to the 2015 Paris Agreement?
Another big issue: Where exactly is this climate change if it is the end of the world if we do nothing now according to Green Fascist doomniks?
The world's most "greenhouse gas"-polluting country is China. China has been allowed and will be allowed to increase its emissions of so-called greenhouse gases according to the Paris Agreement from 2015 (COP21) by an enormous 450% higher than the 1990 level. The country in the world which is the third largest "greenhouse gas"-polluting country is India. India will be allowed to increase its emissions by 495%. China and India are not alone in being allowed to increase their emissions if you actually believe so. If there really is a human made "CO₂-caused climate crisis", why should any country in the world be allowed to increase its emissions?
Only a handful of countries have to cuttheir "Greenhouse gas"-emissions, according to COP21 (2015 Paris Agreement), not ALL.WHY, if there really is a climate crisis?
If emissions of these so-called "greenhouse gases" really have a demonstrable impact on the climate; Why do the climate hysterics and Green Fascists believe that the anthropogenic contribution, which corresponds to only 2.8‰ (per thousand) of what nature itself emits, is MORE harmful to the climate than the nature itself? Can someone explain it, preferably with a link to empirical real scientific evidence based on real observations and records that follow the standard of the scientific method, and is clear evidence that we the people who live in Japan, Canada, The United States, and in West Europa (EU, including the EEA (Iceland, Liechtenstein, and Norway), Switzerland and Great Britain), is causing the alleged "man-made climate change" since we are the only ones who are forced to reduce our CO₂ emissions according to the 2015 Paris Agreement?Another big issue: Where exactly is this climate change if it is the end of the world if we do nothing now according to Green Fascist doomniks?
The world's most "greenhouse gas"-polluting country is China. China has been allowed and will be allowed to increase its emissions of so-called greenhouse gases according to the Paris Agreement from 2015 (COP21) by an enormous 450% higher than the 1990 level. The country in the world which is the third largest "greenhouse gas"-polluting country is India. India will be allowed to increase its emissions by 495%. China and India are not alone in being allowed to increase their emissions if you actually believe so. If there really is a human made "CO₂-caused climate crisis", why should any country in the world be allowed to increase its emissions?
These are the countries that are allowed toincrease their emissions according to COP21:
• China - Ranking place 1st. for "Greenhouse gas emissions" in the world with 29.18%:
Increase their Greenhouse gas emissions by 450%
• India- Ranking place 3rd. on "Greenhouse gas emissions" in the world with 7.09%:
Increase their Greenhouse gas emissions by 495%
• South Korea - Ranking 9th on "Greenhouse gas emissions" in the world with 1.69%:
Increase their Greenhouse gas emissions by78%
• Indonesia - Ranking 10th on "Greenhouse gas emissions" in the world with 1.48%:
Increase their Greenhouse gas emissions by 535%
• Saudi Arabia - Ranking 11th on "Greenhouse gas emissions" in the world with 1.45%:
Increase their Greenhouse gas emissions by up to 562%
• Brazil - Ranking 12th on "Greenhouse gas emissions" in the world with 1.29%:
Increase their Greenhouse gas emissions by 76%
• Mexico - Ranking 13th on "Greenhouse gas emissions" in the world with 1.23%:
Increase their Greenhouse gas emissions by 72%
• Australia - Ranking 14th on "Greenhouse gas emissions" in the world with 1.16%:
Increase their Greenhouse gas emissions by 4-7%
• Turkey - Ranking 16th on "Greenhouse gas emissions" in the world with 1.03%:
Increase their Greenhouse gas emissions by 356%
• Emirates - Ranking 28th on "Greenhouse gas emissions" in the world with 0.61%:
Increase their Greenhouse gas emissions by 396%
• Vietnam - Ranking place 29 on "Greenhouse gas emissions" in the world with 0.58%:
Increase their Greenhouse gas emissions by 1,164%
• Argentina - Ranking 30th on "Greenhouse gas emissions" in the world with 0.56%:
Increase their Greenhouse gas emissions by 80%
• Philippines - Ranking 36th on "Greenhouse gas emissions" in the world with 0.35%:
Increase their Greenhouse gas emissions by 0-13%
• Chile - Ranking 44th on "Greenhouse gas emissions" in the world with 0.23%:
Increase their Greenhouse gas emissions by 151%
• Morocco - Ranking place 54 on "Greenhouse gas emissions" in the world with 0.16%:
Increase their Greenhouse gas emissions by 347%
• Peru - Ranking place 55 on "Greenhouse gas emissions" in the world with 0.16%:
Increase their Greenhouse gas emissions by 143%
• New Zealand - Ranking place 74 on "Greenhouse gas emissions" in the world with 0.09%:
Increase their Greenhouse gas emissions by 72%
•Kenya - Ranking place 91 on "Greenhouse gas emissions" in the world by 0.05%:
Increase their Greenhouse gas emissions by 201%
• Ethiopia - Ranking place 98 on "Greenhouse gas emissions" in the world with 0.03%:
An increase of 250%
These are the only countries that have tocut their emissions according to COP21:
• USA - Ranking place 2nd. on "Greenhouse gas emissions" in the world with 14.02%:
Cut their Greenhouse gas emissions by 10-17% (Trump withdrew the USA from the agreement. Biden re-introduced it)
• Japan - Ranking 5th on "Greenhouse gas emissions" in the world with 3.47%:
Cut their Greenhouse gas emissions by 15%
• Canada - Ranking place 7 on "Greenhouse gas emissions" in the world with 1.89%:
Cut their Greenhouse gas emissions by 7-17%
• EU (including the EEA (Iceland, Liechtenstein, and Norway), Switzerland, and Great Britain), Ranking place? on "Greenhouse gas emissions" in the world by ?%:
Cut their Greenhouse gas emissions by 40%
• Norway - Ranking 64th on "Greenhouse gas emissions" in the world with 0.12%:
Cut their Greenhouse gas emissions by 50 to 55%
Ask yourself why little Norway is the country in the world that has to cut the most of all countries in the world, even though our emissions ONLY amount to 4‰ (per thousand) of what China emits and they will be allowed to increase their emissions by enormous values while we are to halve? The answer to that is not to be found in climate issues that for sure. There are COMPLETELY other reasons why we in the Western Word and Japan should be affected in a way that puts our entire free existence as free countries and people at risk - NOT the climate changes caused by humans...
https://www.cnbc.com/2021/05/06/chinas-greenhouse-gas-emissions-exceed-us-developed-world-report.html
https://www.bbc.com/news/world-asia-57018837
The goal of environmental activists is not to save the world from ecological disaster but to destroy capitalism
Not everyone has forgotten that at a press conference in October 2015 in Brussels, Christiana Figueres, executive secretary of the U.N.'s Framework Convention on Climate Change, admitted that the goal of environmental activists is not to save the world from ecological disaster but to destroy capitalism. Doesn't that say enough?https://www.investors.com/politics/editorials/climate-change-scare-tool-to-destroy-capitalism/
The south polar ice cap of Mars is melting
https://science.nasa.gov/science-news/science-at-nasa/2003/07aug_southpole
 |
| The south polar ice cap of Mars is melting |
The temperature increases before CO₂ increases according to real science
Empirical evidence from core drill samples from the Vostok ice shows temperature increases before CO₂ increases in every piece with a difference of about 800 years. Scientific facts that cause the Green Fascists to have a mega attack of cognitive dissonance. The question is how does the Intergovernmental Panel on Climate Change (IPCC) determine that an increase in atmospheric CO₂ causes an increase in global temperature? The answer is actually as unscientific as it gets. They just assumed that was the case…Did someone say scientific? It is not scientific when climate scientists do not follow the scientific method in all their work. Assumptions are not science and never have been.
https://cdiac.ess-dive.lbl.gov/trends/co2/vostok.html
Milanković cycles
These three variations are called Milanković cycles. It is mainly this variation that creates changes in climate on Earth together with the changes that occur on the Sun over time.
That the Milanković cycles are totally unknown to many of those who believe in the world's biggest conspiracy theory - "man-made climate change", or those who even reject those cycles as having anything to do with climate change, is nothing new at all. It says a lot about the level of knowledge when Green-fascists actually don't understand that the Milanković cycles change the angle of the sun's light and thus vary where the most intense point of the sun's rays hits the earth, which will lead to climate change. It is quite self-explained that when the "center" of the sun's light contact surface is constantly changing, there is also a change in the climate. Even further out in the sunbeam's contact area, there will be noticeable changes, because the intensity of the sunbeam has changed from what it was. Like melting North Pole ice, Greenland's glaciers, or other glaciers. But advanced thinking like that is green fascists not capable of understanding until they wake up from their one-track thinking about "man-made climate change" and open up their eyes to see realities rather than the fantasy of the IPCC and others.
The inclination angle of the Earth's axis (the axial tilt of the earth)
 |
| Illustration showing the axial tilt of the earth |
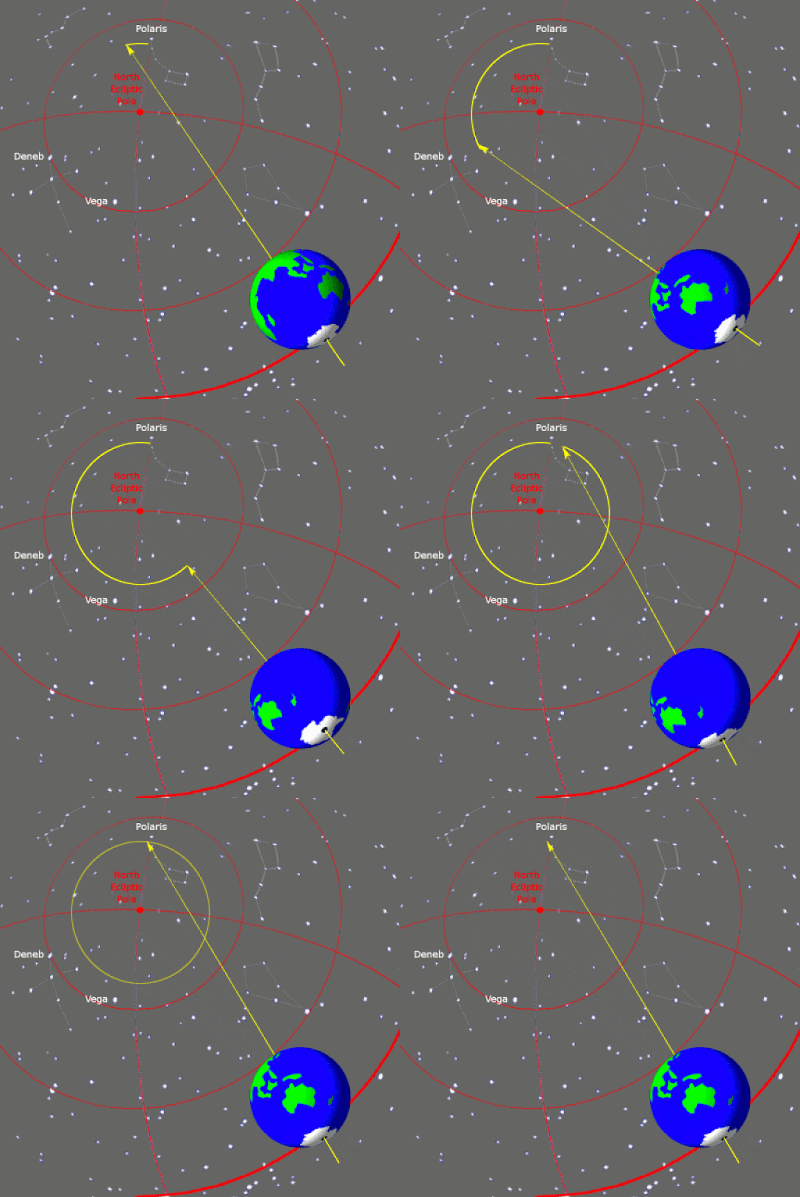
The axial precession of the Earth's axis
Axial precession is a gravity-induced, slow and continuous change in the orientation of the Earth's rotational axis and the gradual shift in the orientation of the Earth's rotational axis in a cycle of approximately 26,000. A movement of the Earth's axis reminiscent of a spinning bass top.
 |
Illustration showing the Earth's precession |
 |
| Animation of the Earth's precession |
Video Credit: NASA/JPL-Caltech
The orbital eccentricity of the Earth's orbit
Eccentricity: The Earth's annual pilgrimage around the Sun is not completely circular, but in our time it is quite close. Over time, the gravitational force from our Solar System's two largest gas giant planets, Jupiter and Saturn, is the reason why the shape of the Earth's orbit varies from an almost circular to a slightly elliptical orbit.Eccentricity measures how much the shape of the Earth's orbit goes from a perfect circle to an ellipse. These variations affect the distance between the Earth and the Sun. Eccentricity causes our seasons to be slightly different lengths, with Northern Hemisphere summers currently about 4.5 days longer than winters, and springs about three days longer than autumns. As the eccentricity decreases, the length of our seasons gradually evens out.
The difference in distance between Earth's closest approach to the Sun (known as perihelion), which occurs on or about January 3 each year, and its furthest departure from the Sun (known as aphelion) which occurs on or about July 4, is currently approx. 5.1 million kilometers (3.2 million miles), a variation of 3.4%. This means that every January there is about 6.8% more incoming solar radiation that hits the Earth than it does in July.
When the Earth's orbit is at its most elliptical, about 23% more incoming solar radiation hits the Earth at the planet's closest approach to the Sun each year than it does at its furthest departure from the Sun. Currently, the Earth's eccentricity is close to its least elliptical (most circular) orbit and is decreasing very slowly in a cycle spanning 100,000 years.
 |
| The Earth's Eccentricity |
Video Credit: NASA/JPL-Caltech
Example of what the Earth's axial precession causes of changes over time
 |
| Earth axial precession |
How increasing CO₂ leads to an increased negative greenhouse effect in Antarctica
How will Green fascists explain this, if an increased CO₂ level really causes an increase in temperature?
https://doi.org/10.1002/2015GL066749
The medieval Warm Period is the main reason for today's CO₂ increase. Not industrialization nor the anthropogenic contribution to CO₂
 |
| The Medieval Warm Period that IPCC and Michael Mann have tried to erase |
 |
| Ice core drilling in Greenland indicates the following temperature fluctuations over the past 10,000 years. |
 |
| Ice core drilling in Greenland indicates the following temperature and CO₂ fluctuations over the past 10,000 years. |
Getting rid of the Medieval Warm Period is not the only forgery attempt that was done by Green Fascist scientists
Michael Man's Nature Trick to Hide The Decline
Picture Credit: Josh at "Cartoons by Josh"
(https://cartoonsbyjosh.co.uk/)
Dr. Tim Ball Defeats Michael ‘Hockey Stick’ Mann’s Climate Lawsuit
The Supreme Court of British Columbia has dismissed Dr. Michael Mann’s defamation lawsuit against Canadian climatologist Dr. Tim Ball.
https://climatechangedispatch.com/tim-ball-defeats-michael-mann-lawsuit/
Mann’s “hockey stick” graph, first published in 1998 was featured prominently in the third assessment report of the Intergovernmental Panel on Climate Change (U.N. IPCC 2001 climate report). The graph showed a spike in global average temperature in the 20th Century after about 500 years of stability. Real scientists have long claimed Mann’s graph was fraudulent. There is no sign of The Medieval Warm Period, which indicates that the IPCC and Michael Mann have tried to erase it.
Michael Mann’s “hockey stick” graph, published in 1998:
https://www.nature.com/articles/33859
The 1st assessment report of the Intergovernmental Panel on Climate Change (U.N. IPCC 1990:
https://www.ipcc.ch/site/assets/uploads/2018/03/ipcc_far_wg_I_full_report.pdfThe 3rd assessment report of the Intergovernmental Panel on Climate Change (U.N. IPCC 2001:
https://www.ipcc.ch/site/assets/uploads/2018/03/WGI_TAR_full_report.pdf
Print Screen of graphs on page 250 in IPCCs full report of
the Intergovernmental Panel on Climate Change 1990
Print Screen of graphs on page 14 in IPCCs full report of
the Intergovernmental Panel on Climate Change 2001Tampering with actual data
Take a closer look at the first graph on the print screen of graphs on page 14 in IPCC's full report of the Intergovernmental Panel on Climate Change 2001.
IPCC's average temperature in 1921, shows ca. -0.27°C, but according to history 1921 was
one of the warmest years in recorded time in most of the world according to actual data.
 |
| The New York Herald September 4, 1921 |
 |
| A segment from the article in The New York Herald on September 4, 1921 |
 |
| Lake Morat in the Cantons of Fribourg and Vaud in Switzerland dried out in 1921 |
Follow this link to see Lake Morat yourselves just now - today on a webcam:
https://www.snow-online.com/webcam/murten--morat--see.htm
 |
| Monthly Weather Report of the British Meteorological Office from October 1921 |
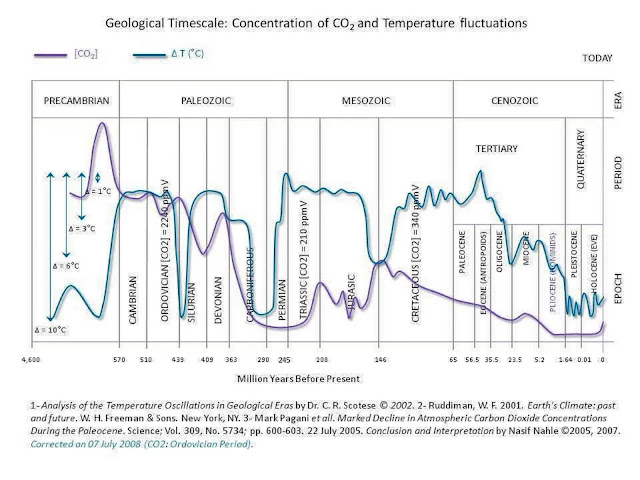
The earth's CO₂-level during the last 450 million years
 |
| Did you know that the earth's temperature and CO₂-level have been much higher than it is today for approximately 90% of the last 600 million years? |
Data of today
See for yourself at NOAA National Centers for Environmental Information, Climate at a Glance: Global Time Series, published in January 2022 at https://www.ncdc.noaa.gov/cag/, if you don't believe my words.
 |
| Actual statement: "We have to get rid of the Medieval Warm Period" |
Source:
The exact source for the graph in the picture above:
https://www.ncdc.noaa.gov/cag/global/time-series/globe/land_ocean/ann/12/2015-2021?trend=true&trend_base=10&begtrendyear=2015&endtrendyear=2021
Global warming can't lead to colder weather
 |
| Dr. Roy Spencer. A meteorologist, a NASA scientist and climate scientist |
"Global Warming" relative to the Earth's average temperature
 |
| A brief history of Settled Science Image credit: cartoonist Ramirez of the Weekly Standard, via http://www.ibdeditorials.com/cartoons. |
 |
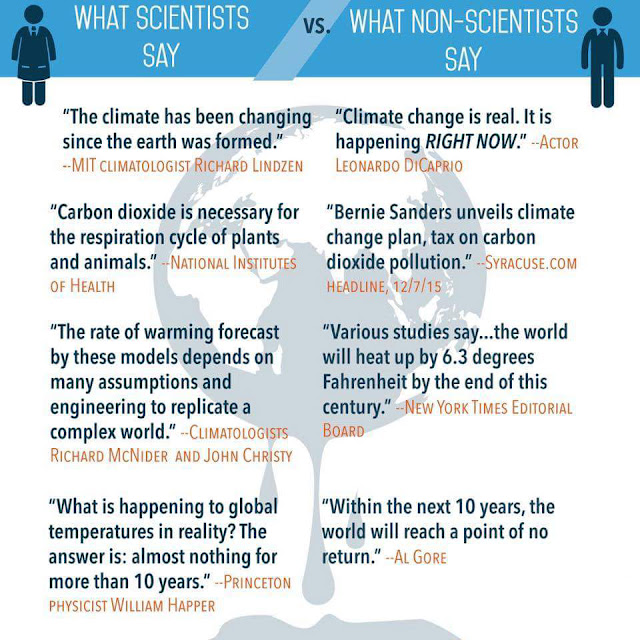
| What scientists say vs. what non-scientists say |
 |
| Temperature correlates with what? |
 |
What's science?
People need to understand the huge difference between academia and a real scientist |
| Once 100 scientists signed a letter against Einstein’s theory of relativity. Einstein’s answer was “They didn’t need 100 signatures. They just need 1 fact” |
 |
| The difference between Science and Religion |
 |
| A graph you never will see posted by anyone supporting or get paid by IPCC |
 |
| Also a graph you never will see posted by anyone supporting or get paid by IPCC |
 |
| The party leader of the Green Fascist (MDG) in Norway: "The problem is that we go to elections in a democracy" |
 |
| Green Fascists are exactly like other fascists |
 |
| Fact-Checking the "Green Fascist Jugend" Greta Thunberg |
 |
| Nazi Fascist Jugend vs the Swedish Green Fascist Jugend. History repeats itself, first as a tragedy, second as a farce - Karl Marx |
Did you know that Greta Thunberg is a "Copy-Cat"?
How many of you actually know that the "Green Fascist Jugend" Greta Thunberg is a "Copy-Cat" of another scared girl named Severn Cullis-Suzuki who spoke something very similar to Grata Thunberg at the United Nations Conference on Environment and Development, Rio de Janeiro, in Brazil, 3-14 June 1992?Info credit:
 |
| Don't call the facts - hate speech. It just shows a total lack of knowledge if you do. |
 |
| For the King, the Fatherland, and the honor of our flag. |
 |
| Norway - a Christian, free, independent, and indivisible kingdom Source: The Constitution of the Kingdom of Norway Article 1. |
section 23 of the Intellectual Property Act, Creative Commons license in
Norwegian Law for use in teaching, training, and commentary.


.jpg)


